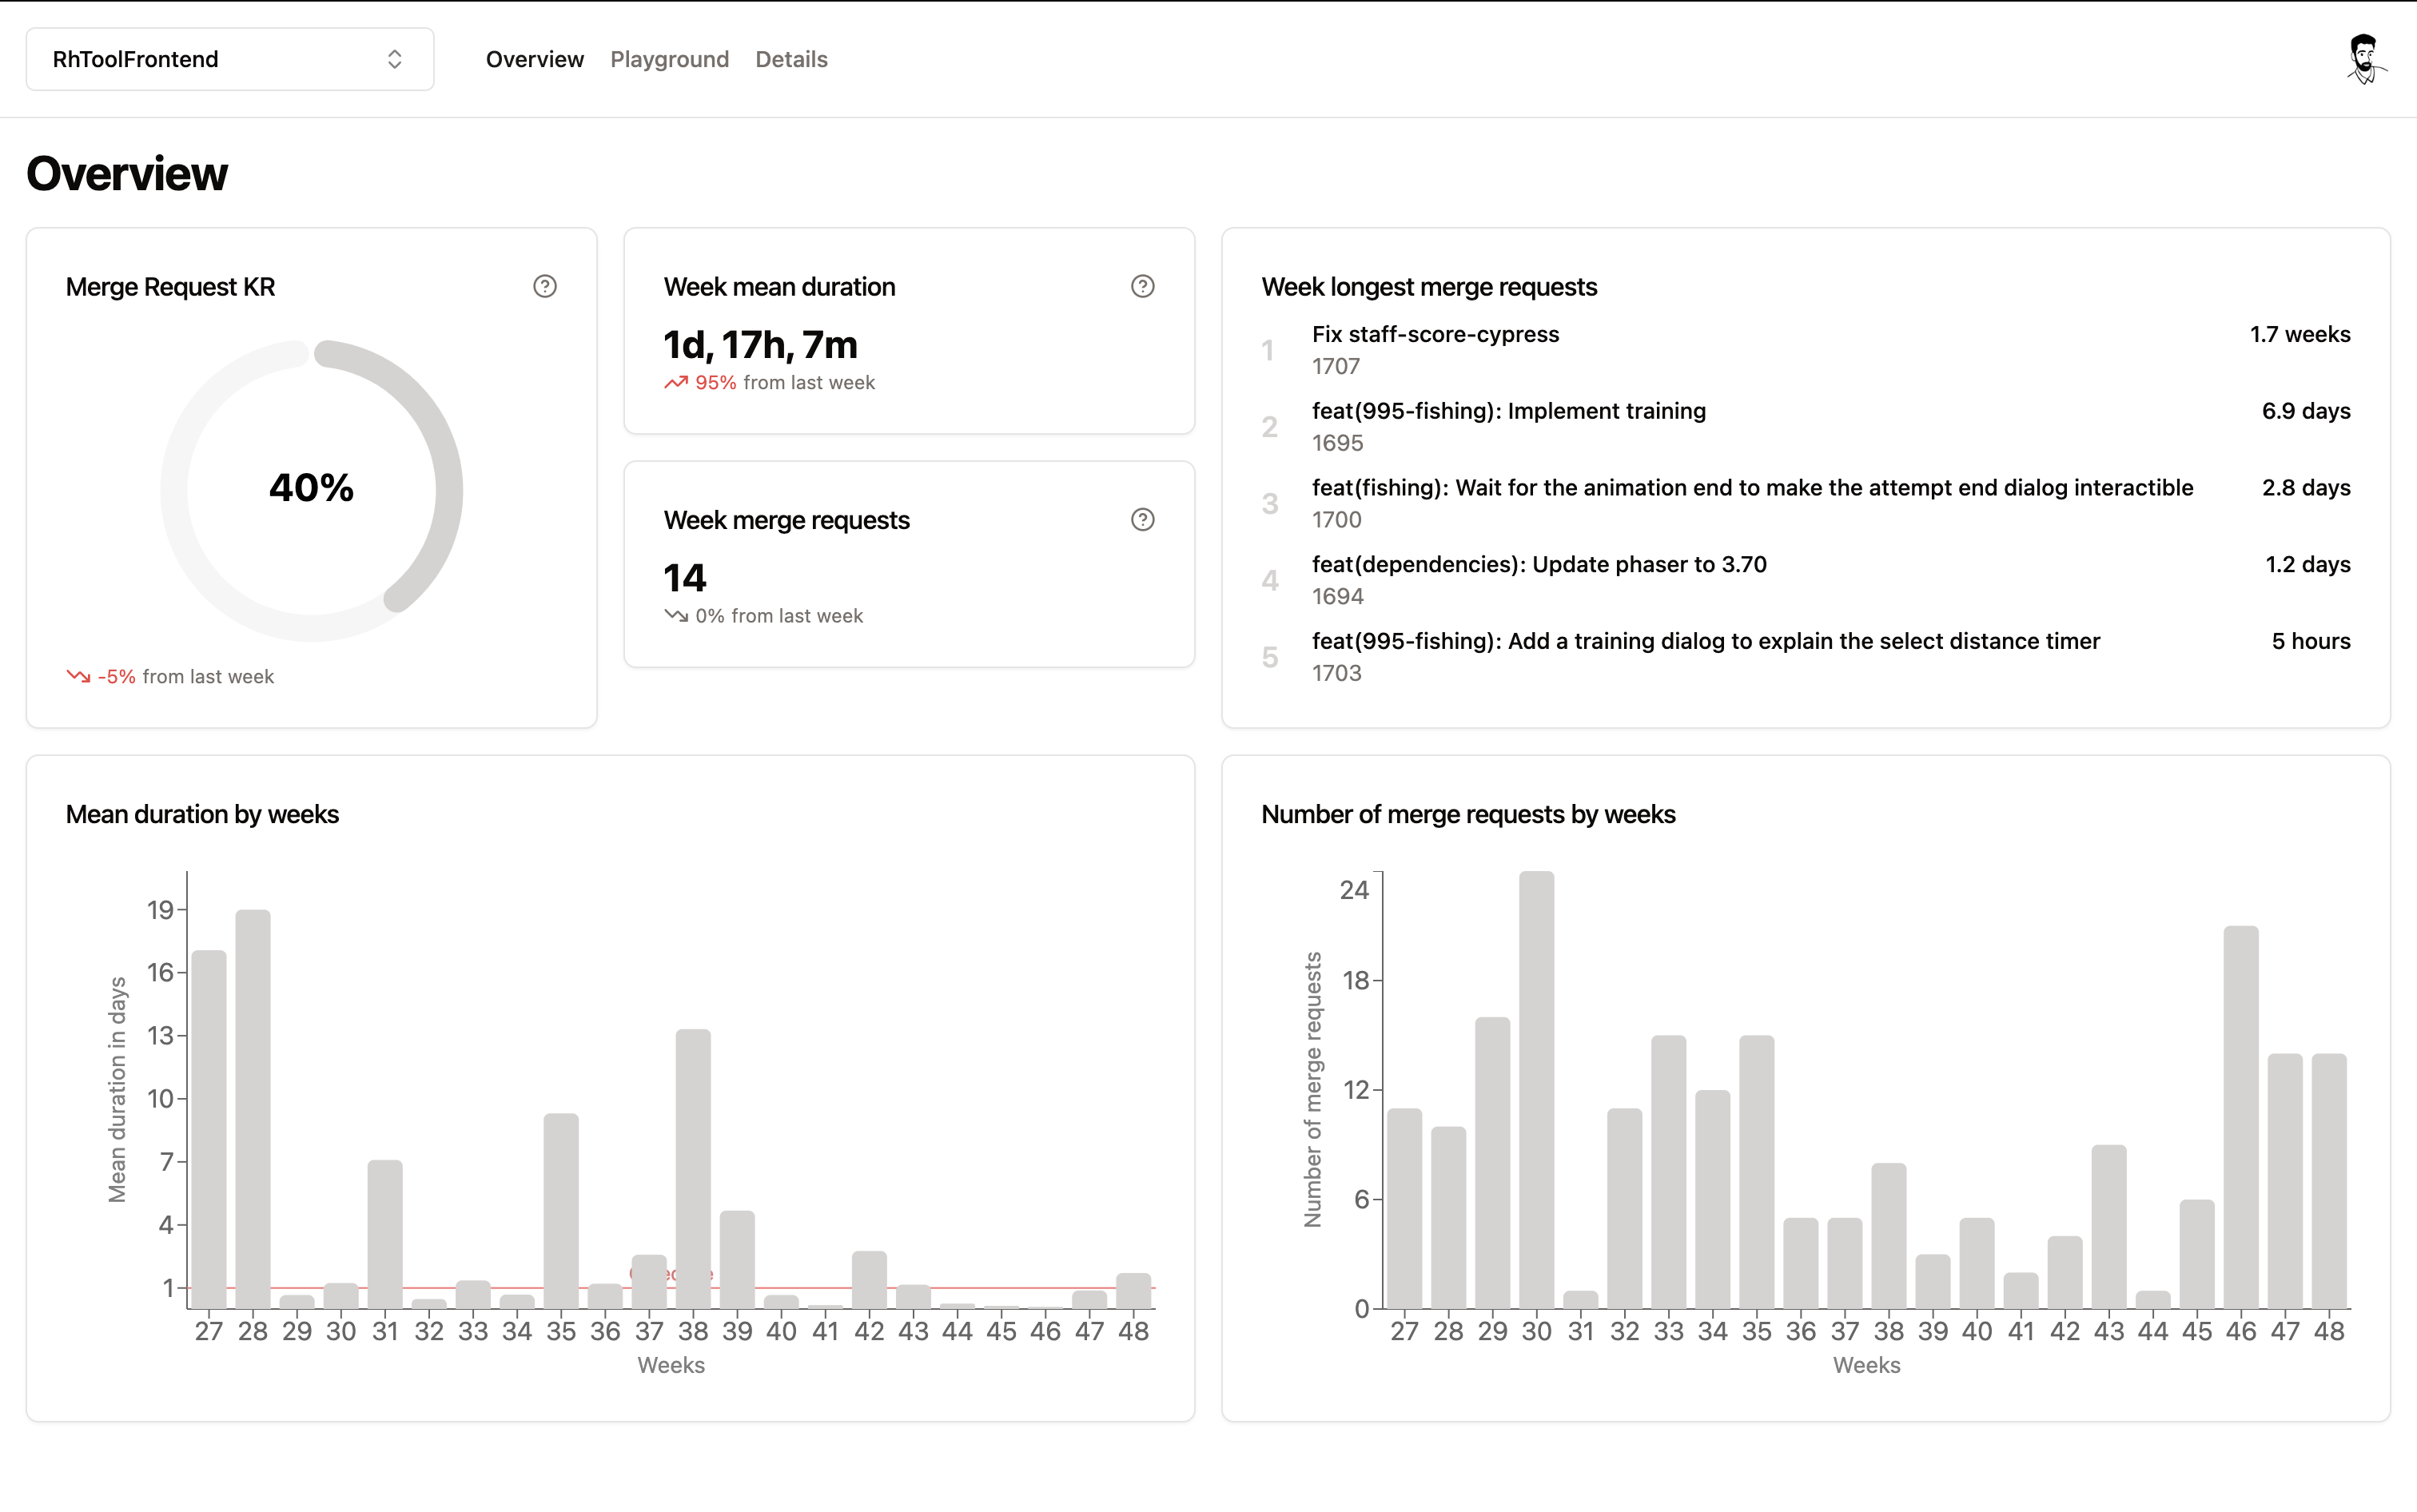
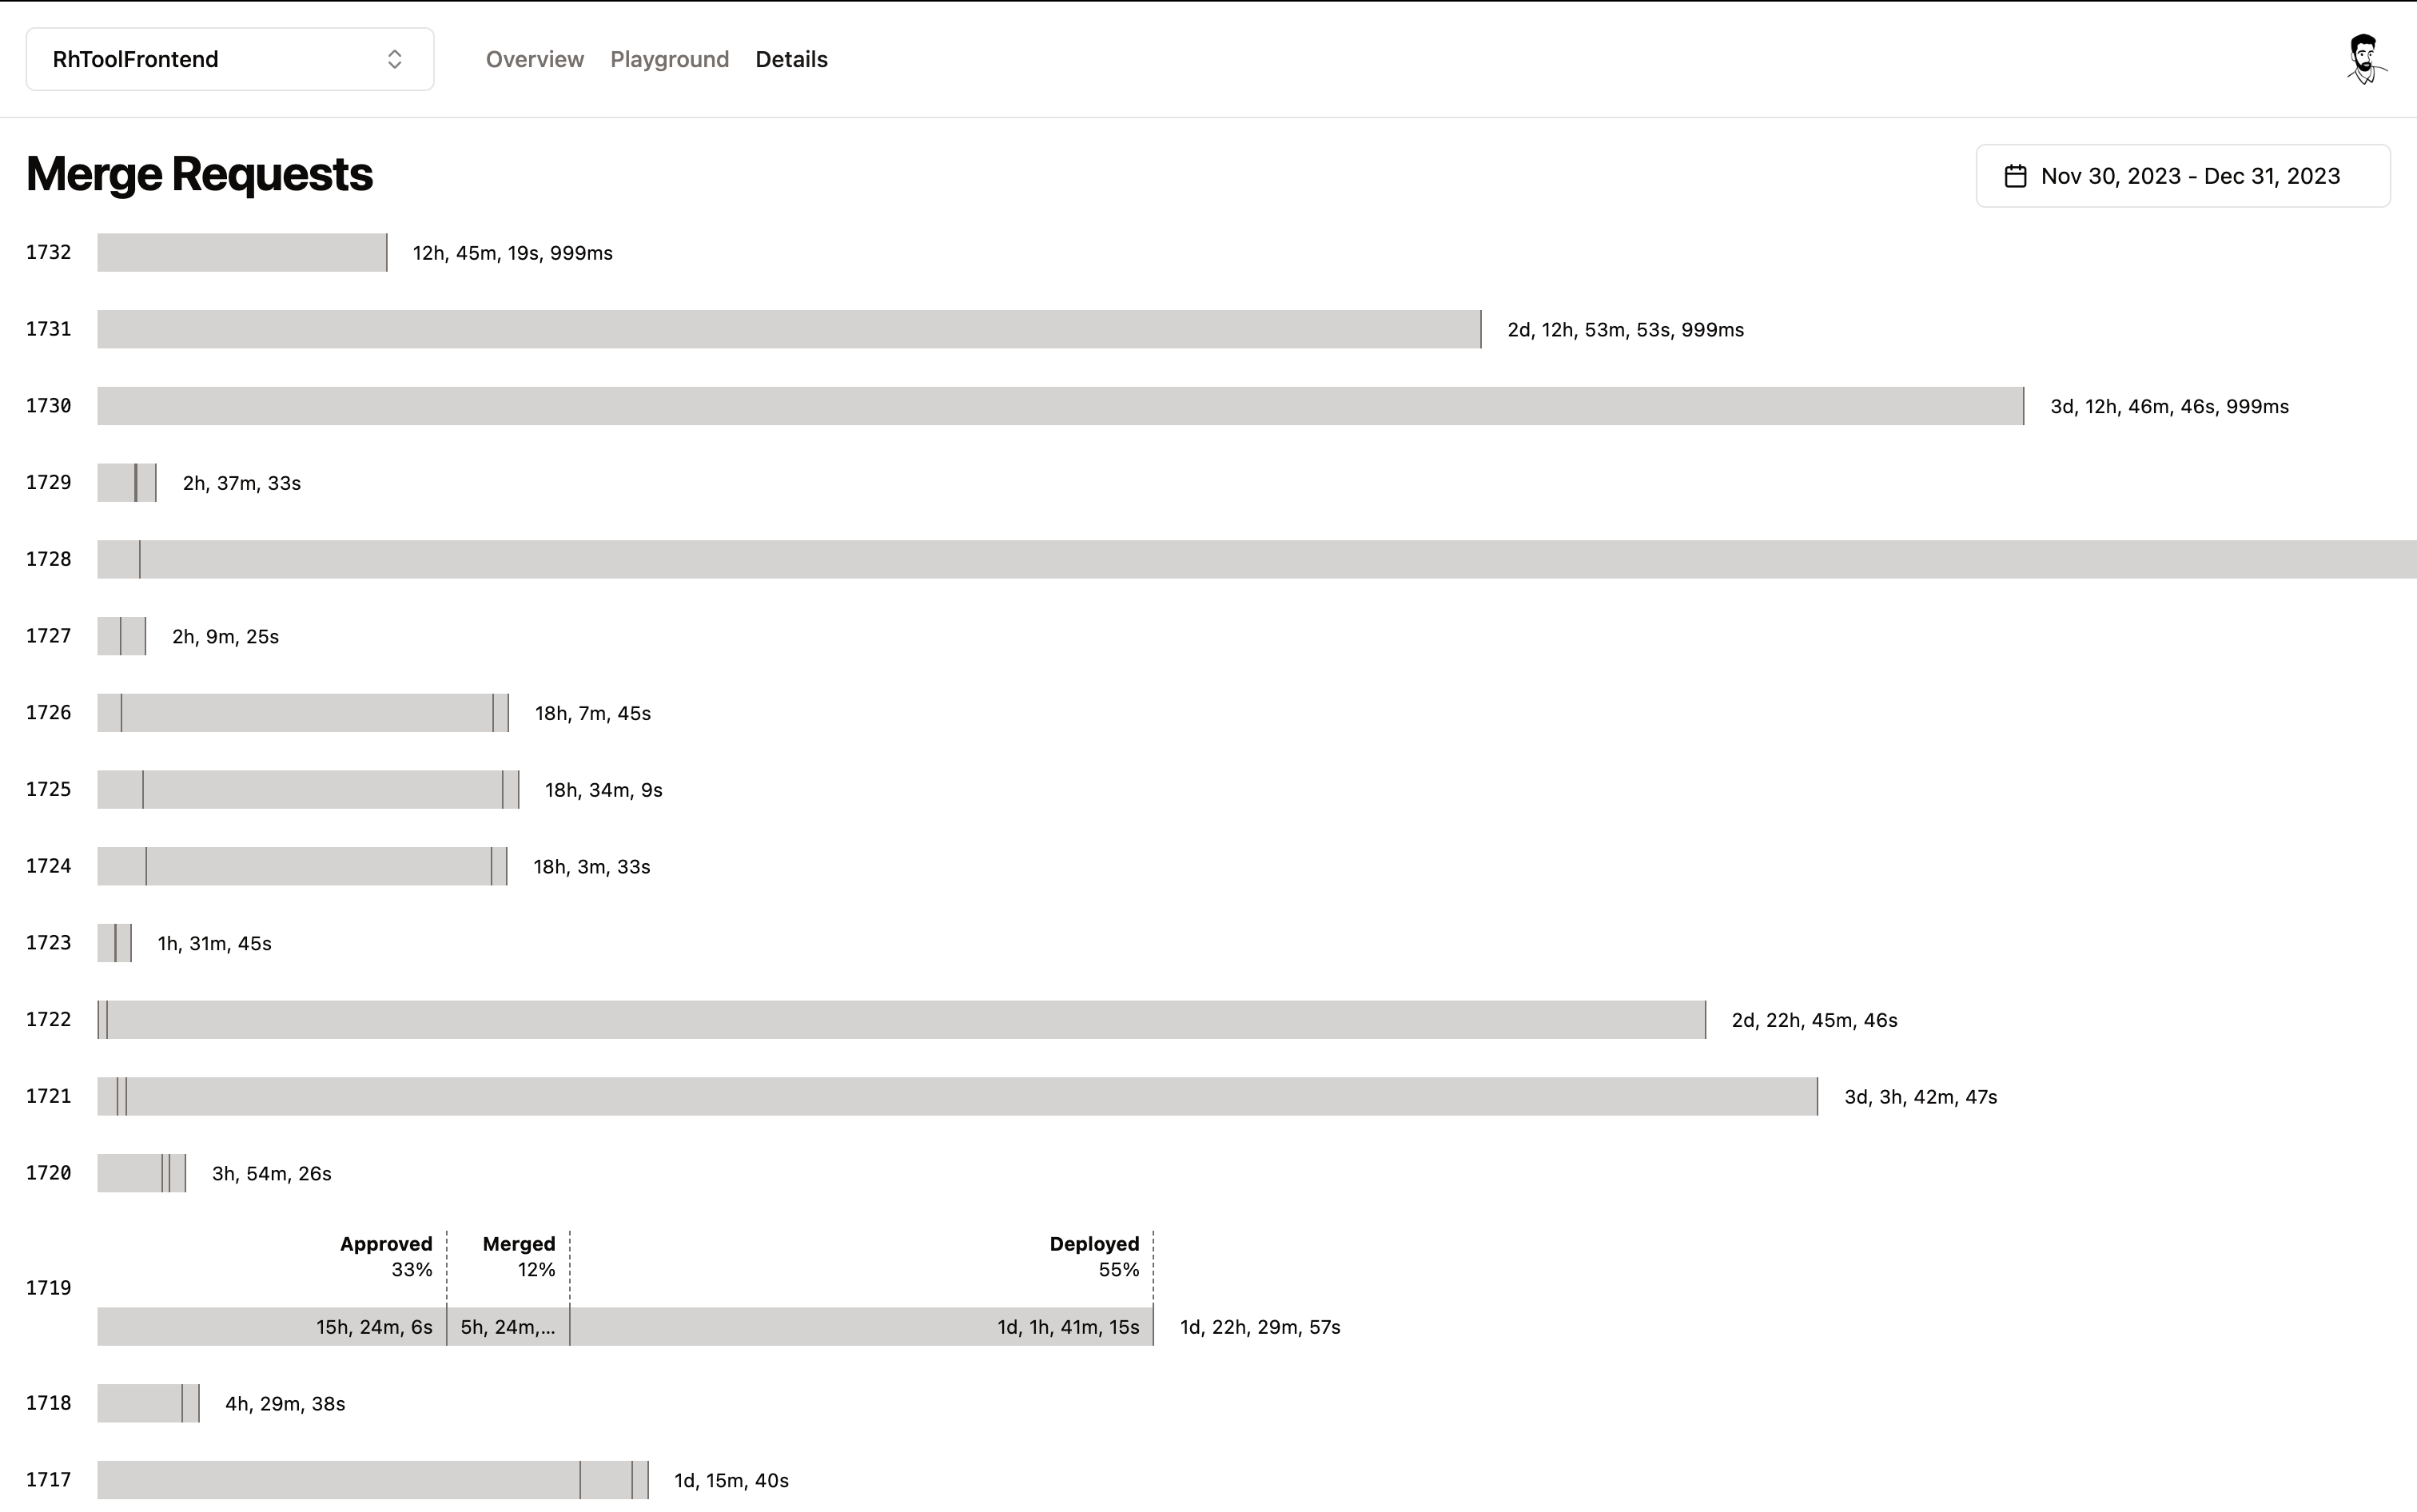
Gitlab dashboard
Screenshots


Technical stack
- NextJS with TypeScript as development framework.
- Tailwind for styling.
- Shadcn for UI components.
- Rechart for charts components.
- Luxon for Date helpers.
- Gitlab API for Gitlab integration.
- Prisma with SQLite for data persistence and optimization.